

Removing undesired identifications
Converting Data to a Processable Form
Perseus

The proteinGroups.txt file contains rows that originate from identifications in a reverse sequence database - false identifications. The first step is to filter them out. Choose the command Filter rows > Filter rows based on categorical column and choose Column: Reverse, Remove matching rows.


Perseus generates a new table with the proteins identified in the reverse sequence database removed.
Next - remove proteins that were identified only by modified peptides. Such identifications are likely to be wrong. Choose the command Filter rows > Filter rows based on categorical column and choose Column: Only identified by site, Remove matching rows.
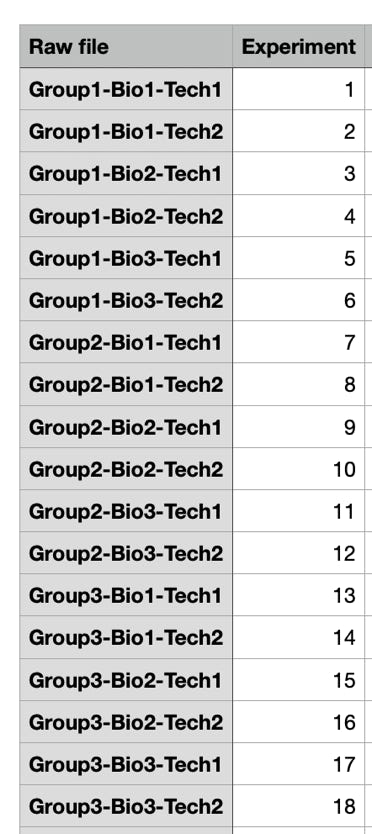
Grouping experiments based on biological and technical repeats
Each column corresponds to an experiments. You have to declare to the programme which experiments are technical repeats and which are biological repeats. This is done by creating for each grouping a new row that gives the members of one group (the repeats) the same value.
Choose the command Annot. rows > Categorical annotation rows.
Click onto the blue check mark to edit the Values column.


Preparing the protein quantities for the statistical evaluation
The t- and ANOVA test require that the data distribution follows a normal distribution. This is more likely for logarithmic intensities than for the intensities itself.
Choose the command Basic > Transform > log2(x).

Proteins that were not quantified in an experiment (quantity: 0) will now be represented by NaN values (Not a Number). In the following we will filter out proteins that have too few valid quantifications in a group. Choose the command Filter rows > Filter rows based on valid values.


There are still proteins which were observed in some but not all chromatographic runs. The missing quantities will be replaced by computed values from an assumed normal distribution of protein quantities.
Choose the command: Imputation > Replace missing values from normal distribution and fill in the parameters Width: 0.8 and Down shift: 1.8


Now, the data is in a form that can be visualised and statistically analysed.
Comments: matthias.wilm@ucd.ie