

Differential Protein Expression Analysis
The focus of this analysis is to determine which proteins are over- or under expressed in comparison to a control. The statistical t-test determines whether two group have the same mean, the ANOVA test whether several groups have the same mean.
Perseus*

Data Import
Load the "proteinGroups.txt" file from a MaxQuant search into Perseus using the Matrix > Green Arrow command.


Move the Label Free Quantification (LFQ intensity ...) columns into the Main section.


Hit the OK Button.


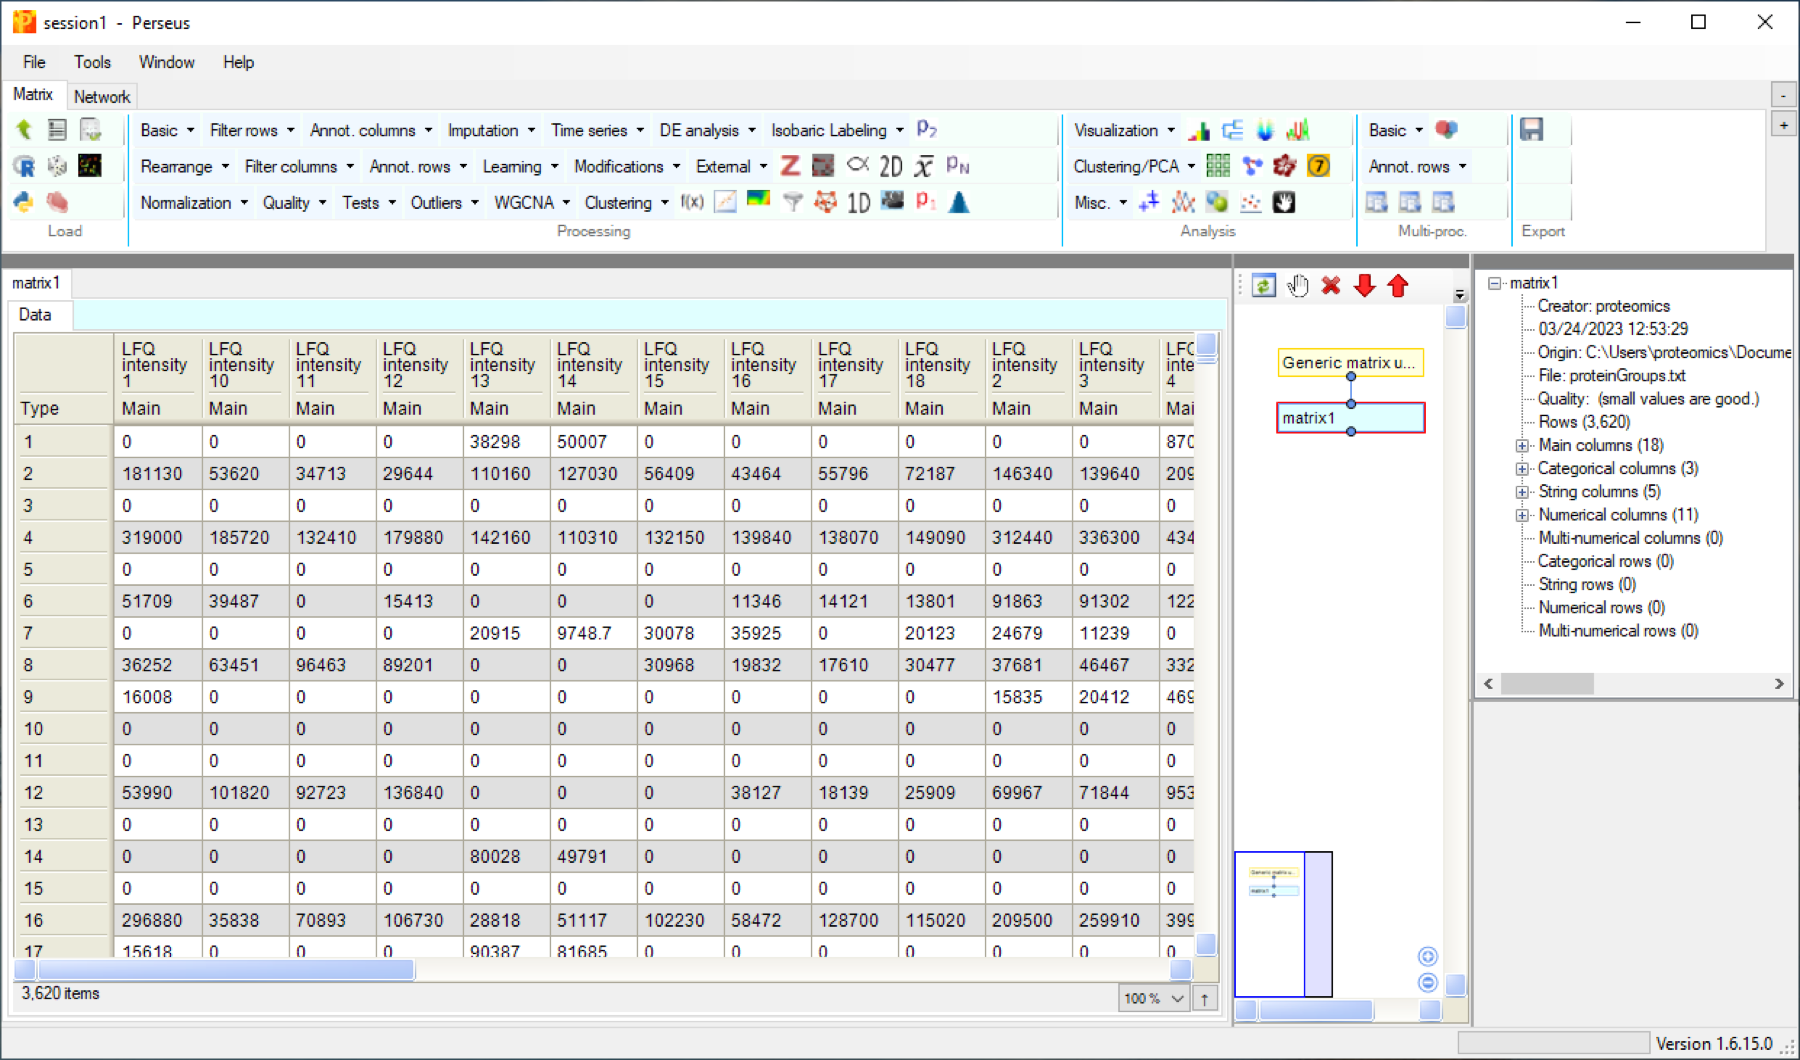

1
4

2

5

3
The Proteus programme interface is divided into several regions:
1 - Data Processing Functions
2 - Visualisation Tools
3 - Export
4 - Tables
5 - Processing steps
*S. Tyanova and J. Cox, “Perseus: A Bioinformatics Platform for Integrative Analysis of Proteomics Data in Cancer Research.,” Methods Mol Biol, vol. 1711, pp. 133-148, 2018
Comments: matthias.wilm@ucd.ie