

Time Course Analysis
Data Analysis and Visualisation
Perseus

Perseus allows to visualise the protein expression over time.
Choose the command: Visualisation > Profile plot and click onto the new tab Profiles.
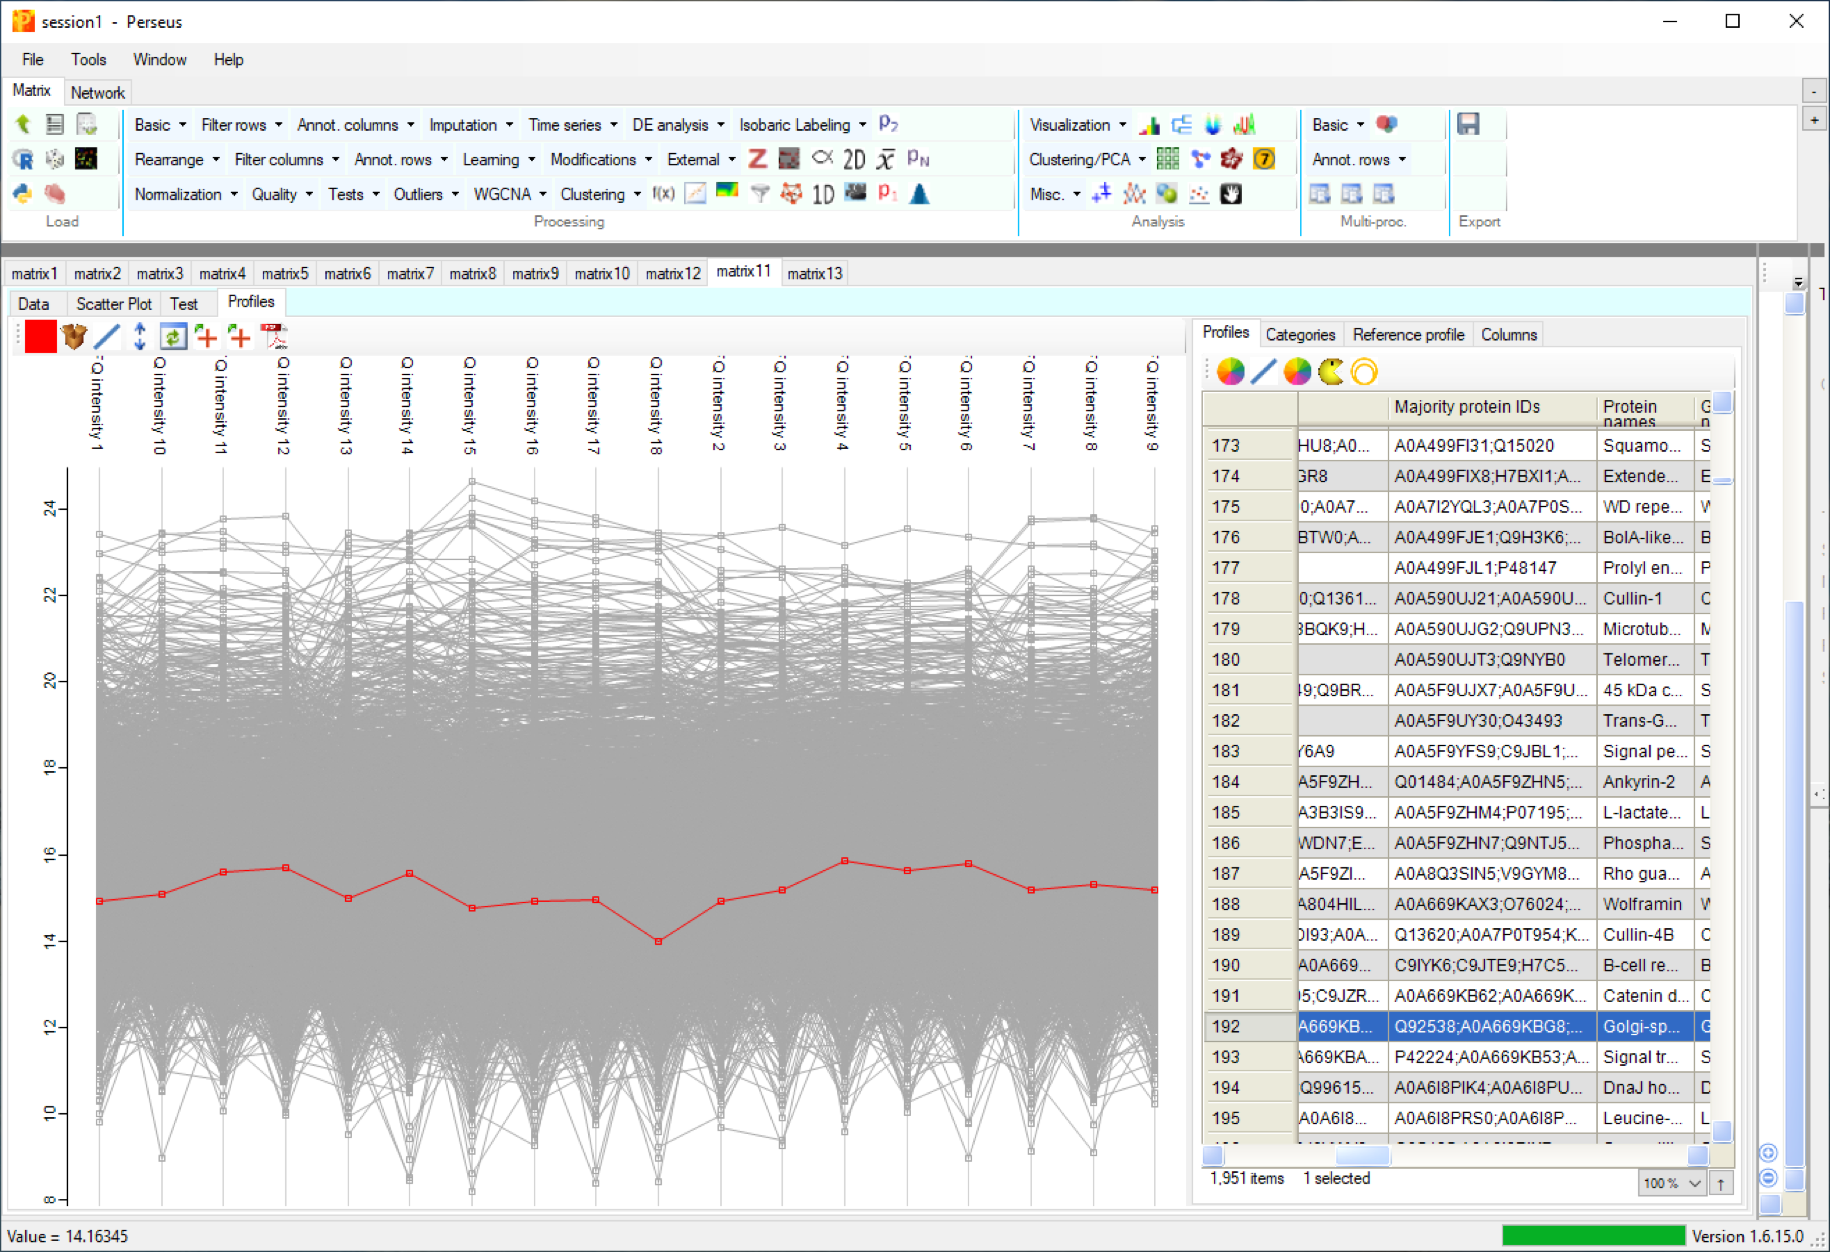
Particular proteins can be highlighted by selecting individual proteins in the table.
Such a profile can be defined as a reference profile by choosing the tab Reference profile.
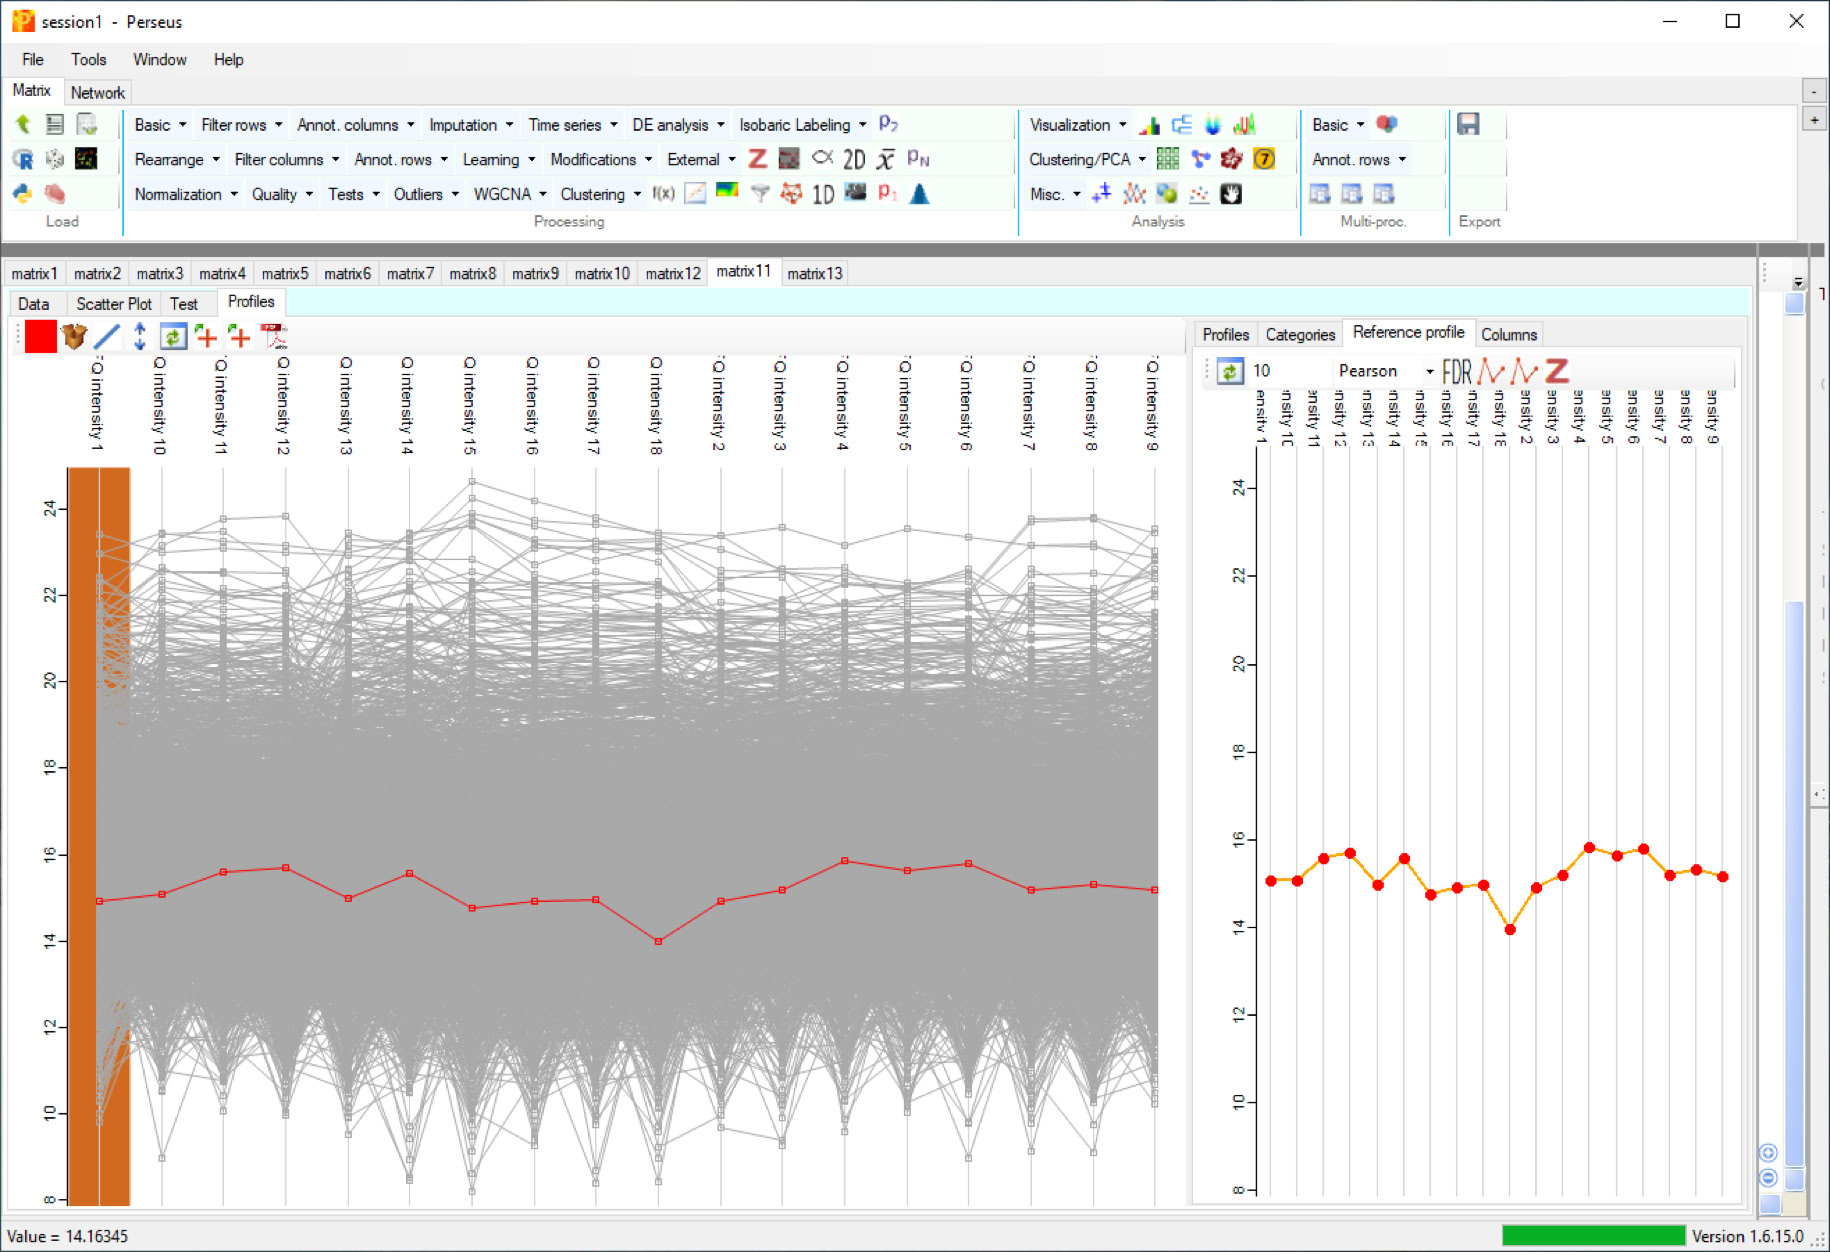

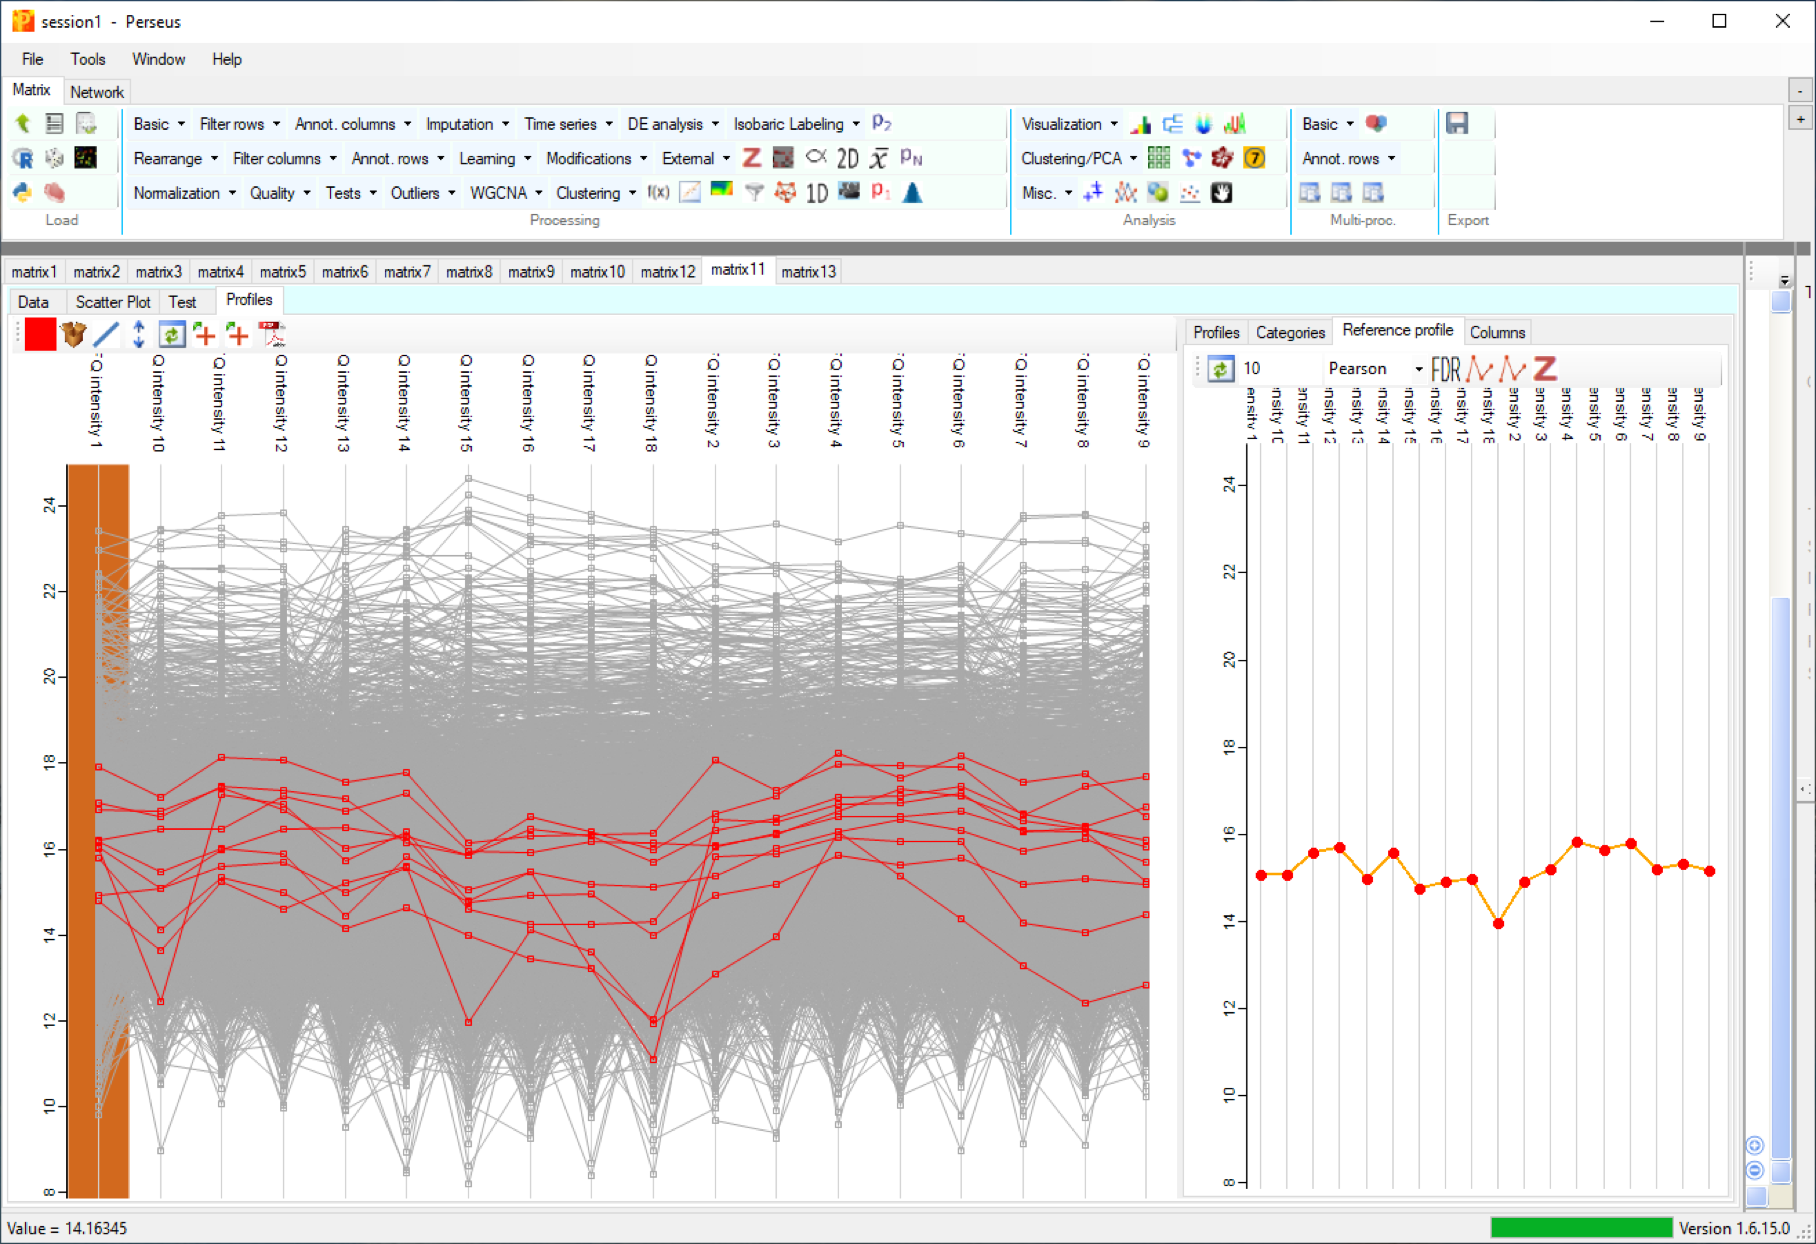
Similar profiles can be found by hitting the Refresh button.
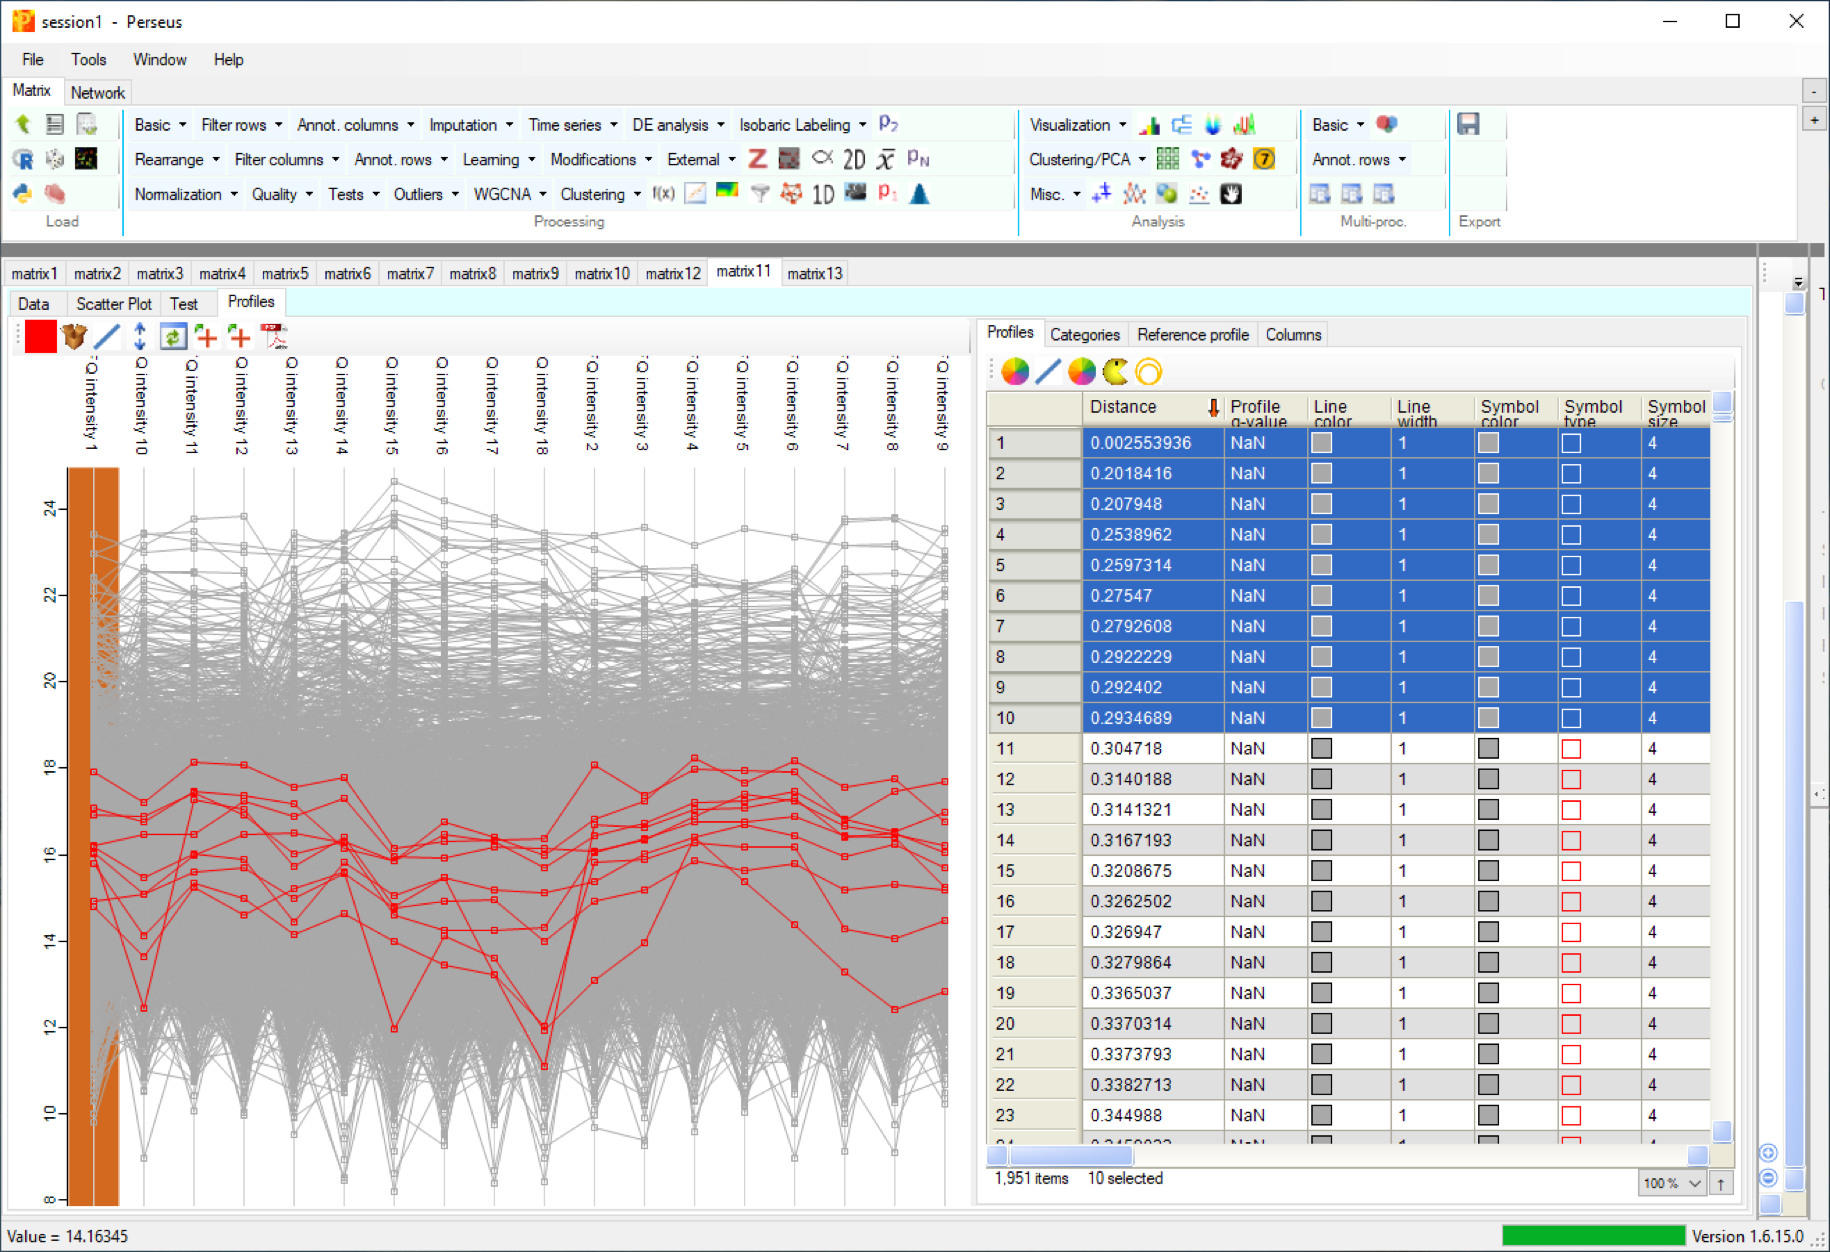
All proteins can be sorted based on their profile-distance to the reference protein in the Profile tab.
Comments: matthias.wilm@ucd.ie