

Differential Expression
Data Analysis and Visualisation
Perseus

To calculate whether two groups have the same expectation value choose the students t-test.
Use command: Tests > Two-sample tests
This will calculate several new columns. The parameter S0 is analogous to the fold change in expression level that should be considered significant. The FDR value the statistical significance level which is required.


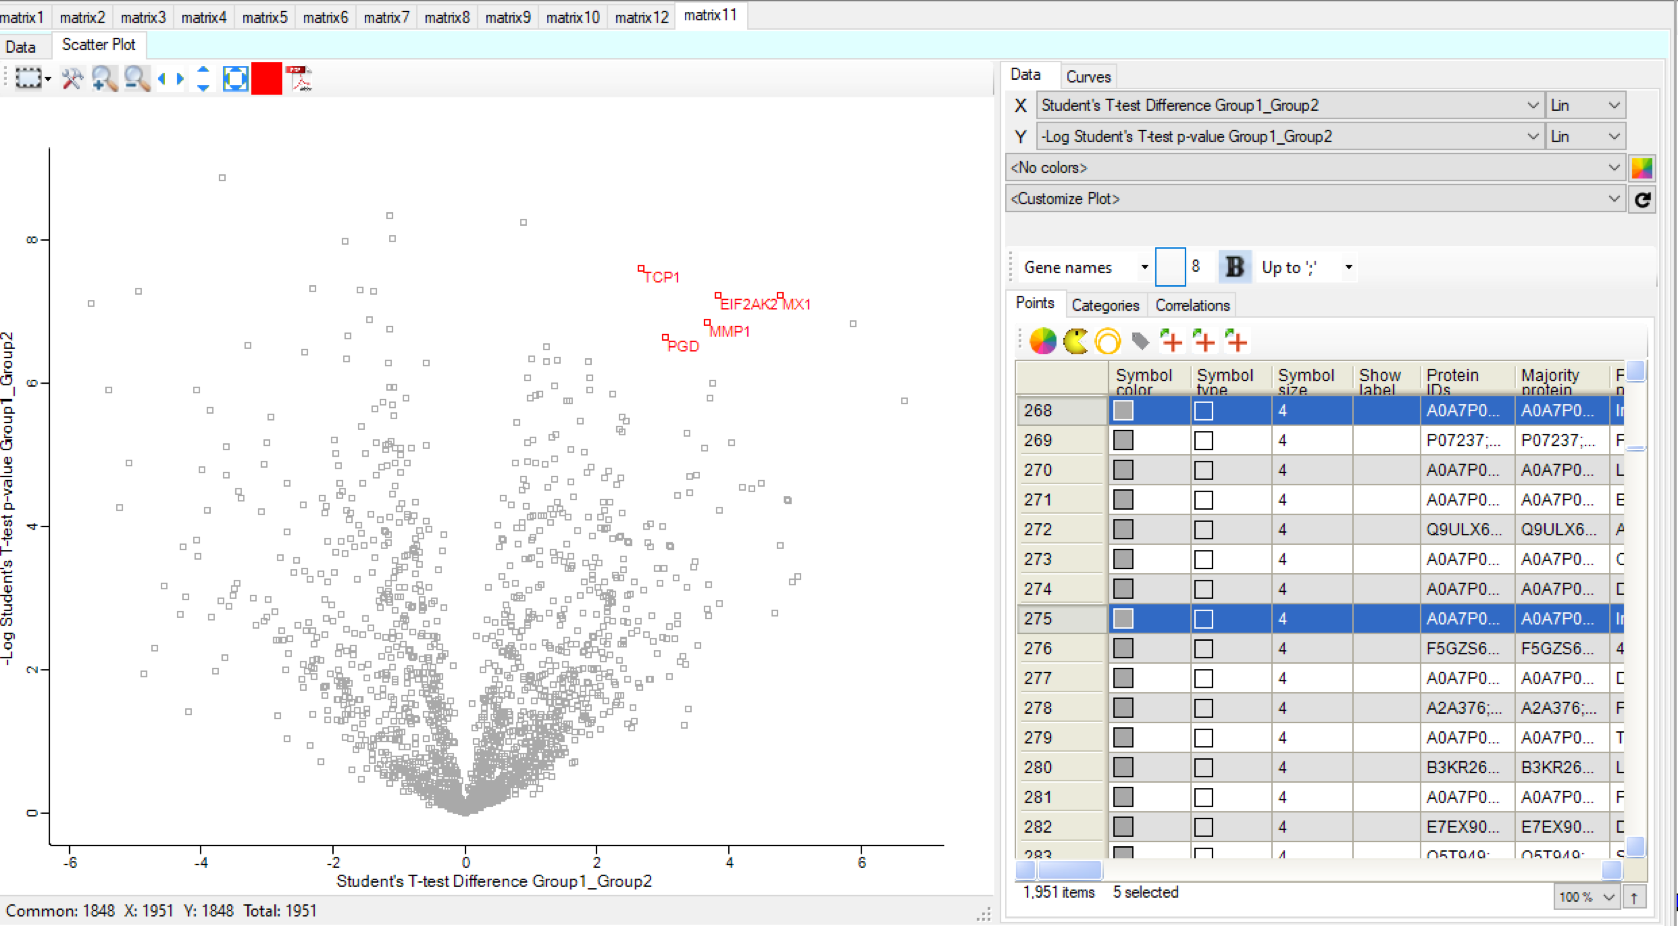
The result of the t-test can be visualised using a scatter plot.
Choose the command: Visualisation > Scatter plot
Choose as x-axis values the difference Student's T-test difference between two groups and as y-axis values the -Log Student's T-test p-value of the same groups.

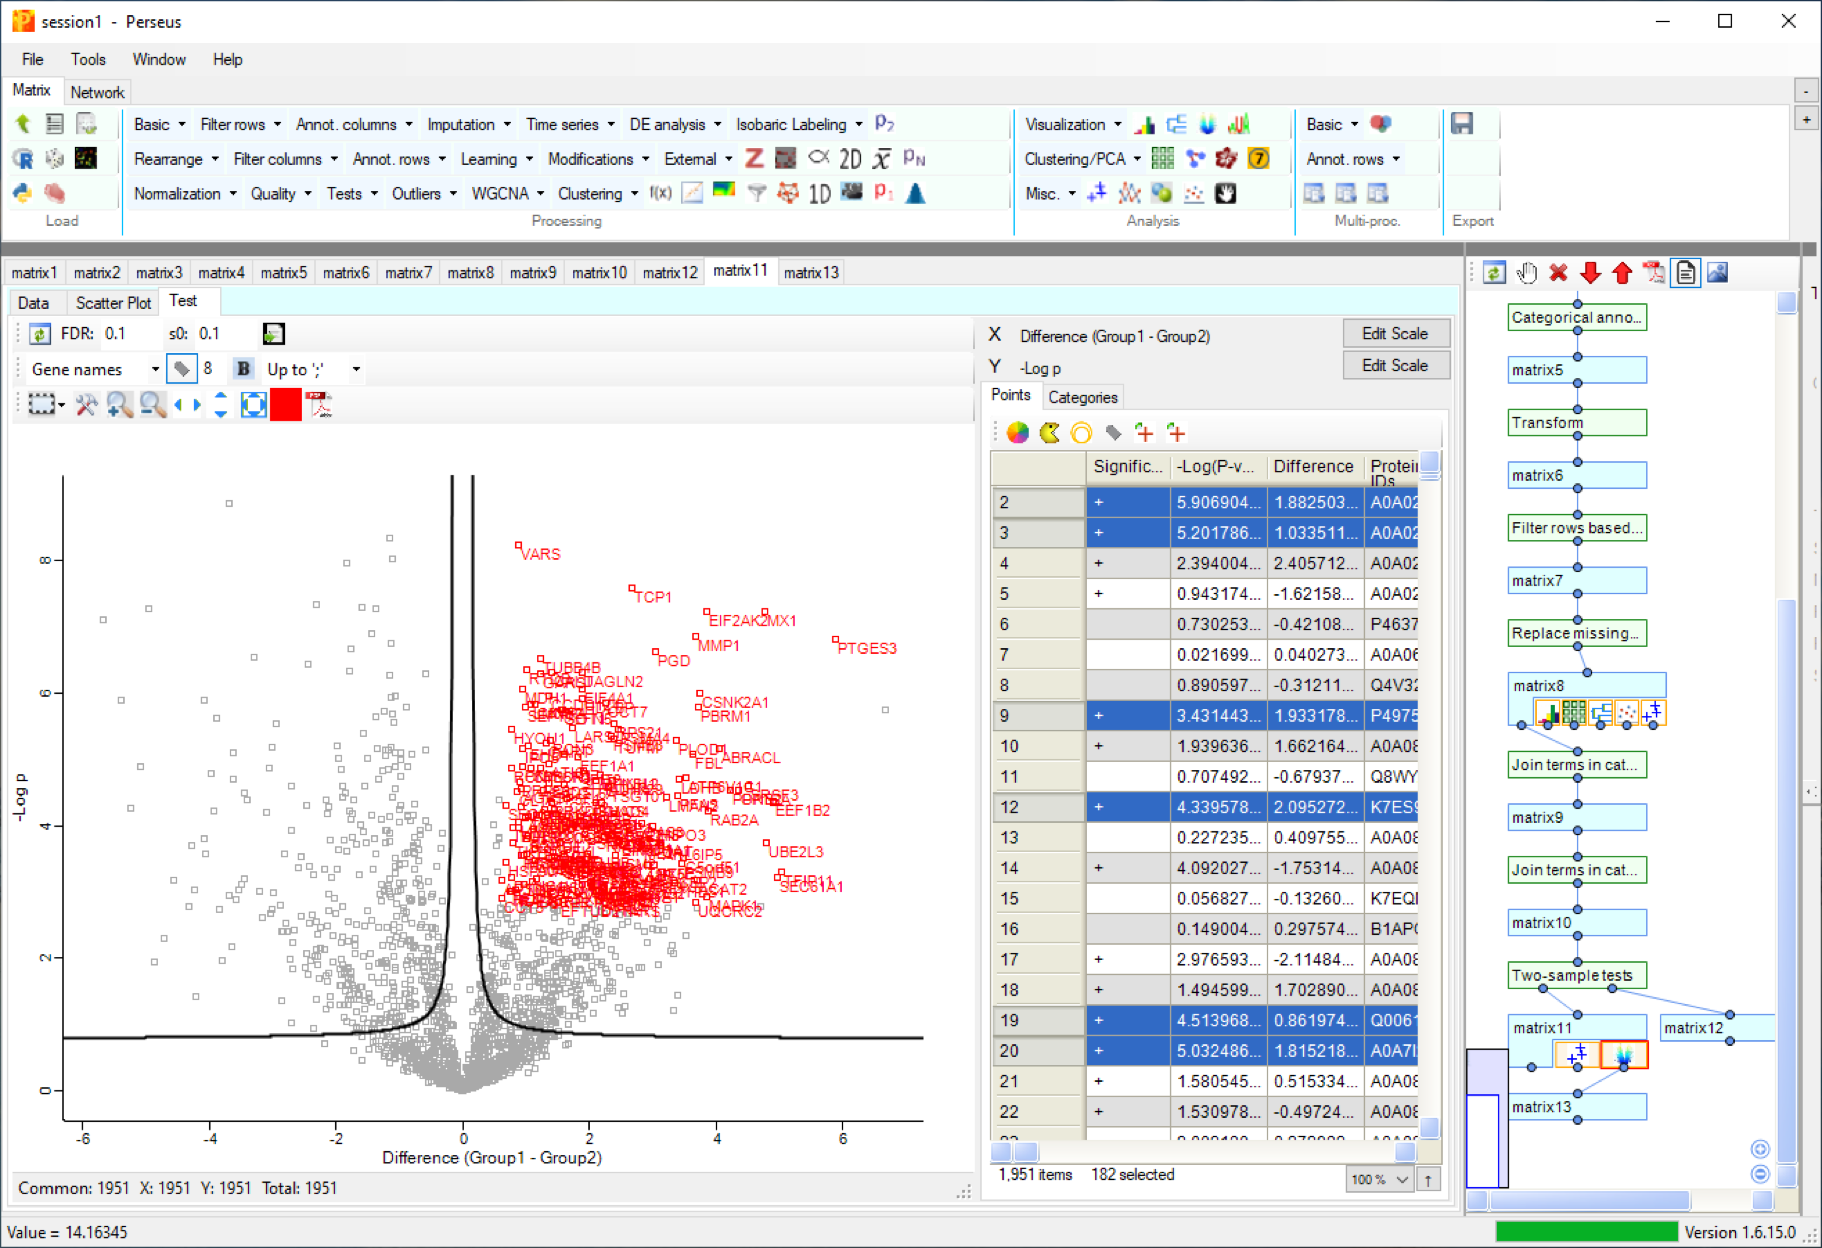
A parameterised access to the student's t-test can be achieved by using a volcano plot.
Choose the command: Misc. > Volcano plot. Choose the groups to compare, the S0 parameter and the false discovery rate (FDR) value.


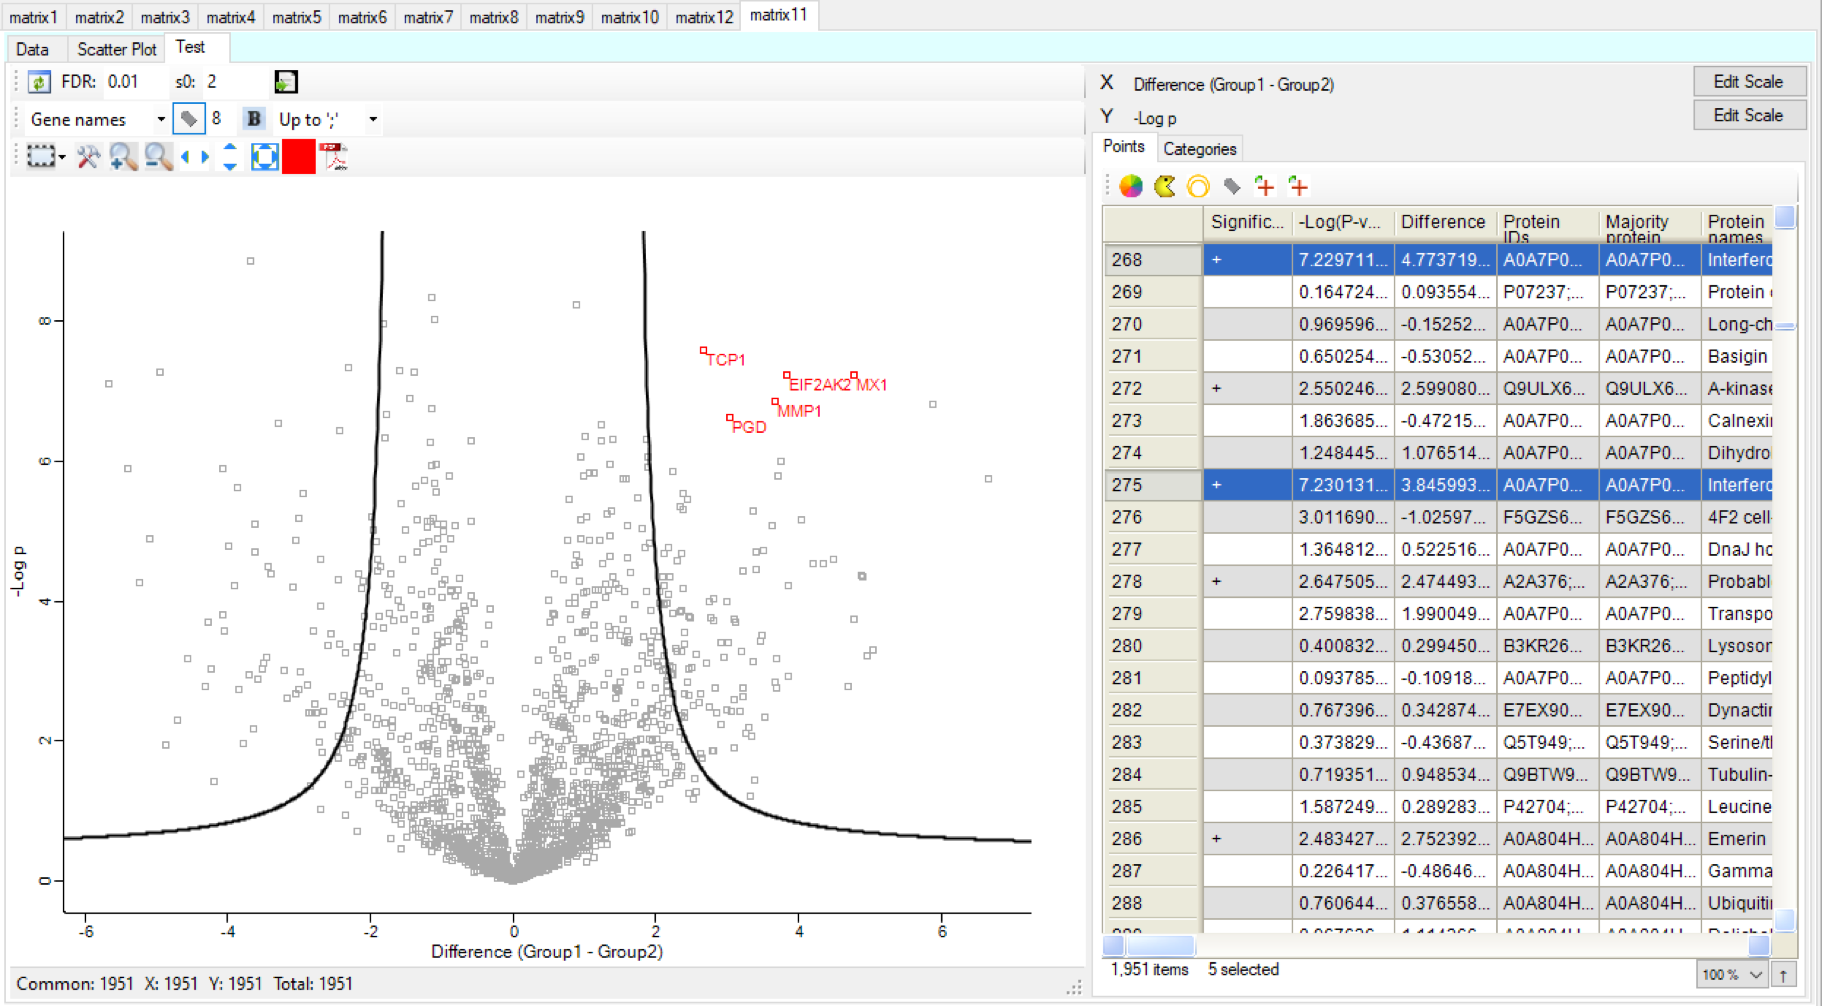
All proteins with expression differences beyond the solid line have significantly changed. The false discovery rate (FDR) and s0 parameters can be changed and the graphic reflects this change after hitting the update button.
Comments: matthias.wilm@ucd.ie