

Reading in the quantification file "kallisto_output_scaled_per_gene.tsv"
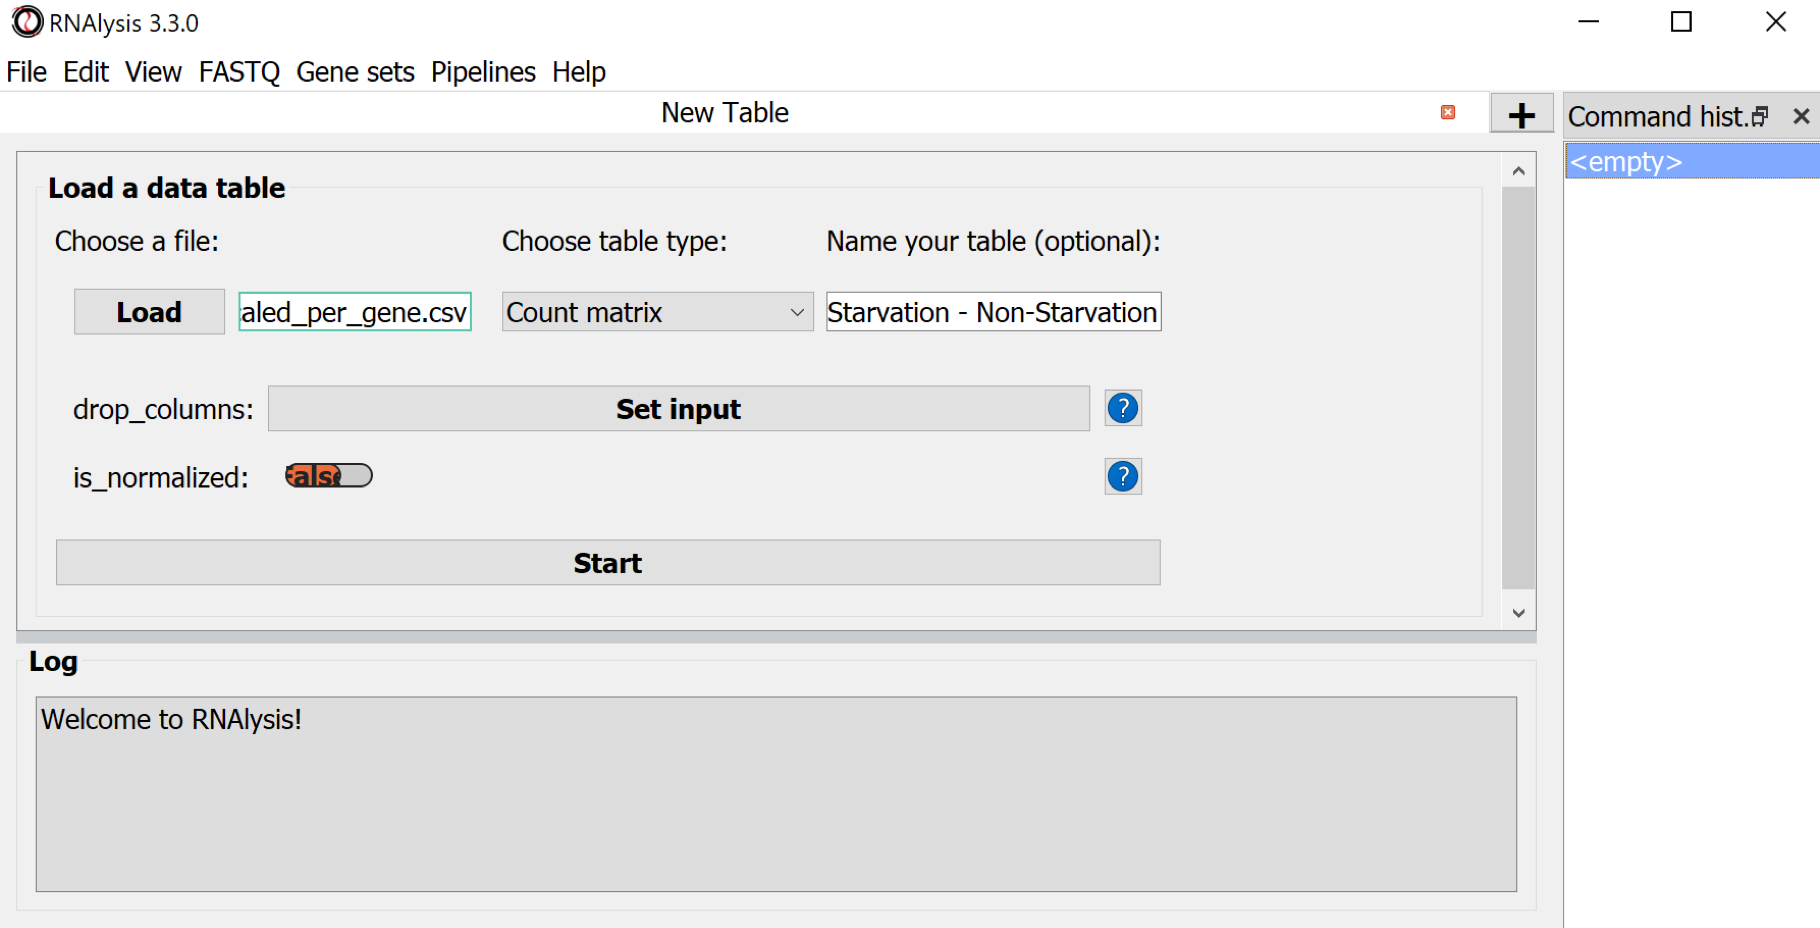
Parameters to set:
- Load : Choosing the quantification file
- Choose table type : Count Matrix
- optional Name your table : A new table name
- Use the button Start to import the data
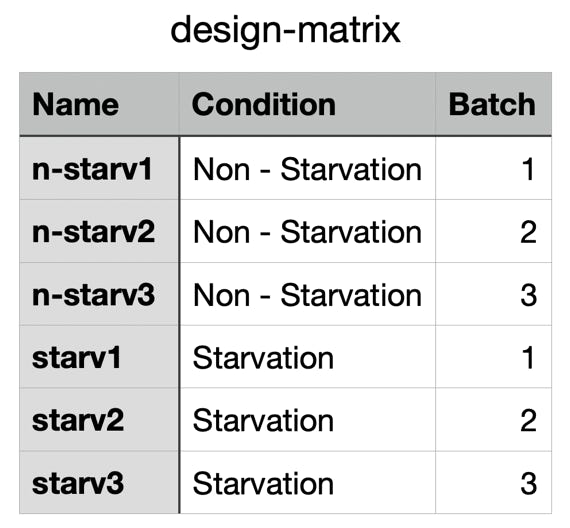
What you need:
- A Design Matrix : Make a table with the following column names and the precise sequence file names (without the
extensions) and save it in csv format
Don't change the column names (!) :
Name: Names of the samples (case sensitive ! - use exclusively lower case and avoid empty spaces in the names)
Condition: The experimental condition - the same condition defines biological repeats
Batch: The same batch defines corresponding samples: Experiment versus it's Control
Choose the button-menu: General > Choose a function... > Run DESeq2 differential expression
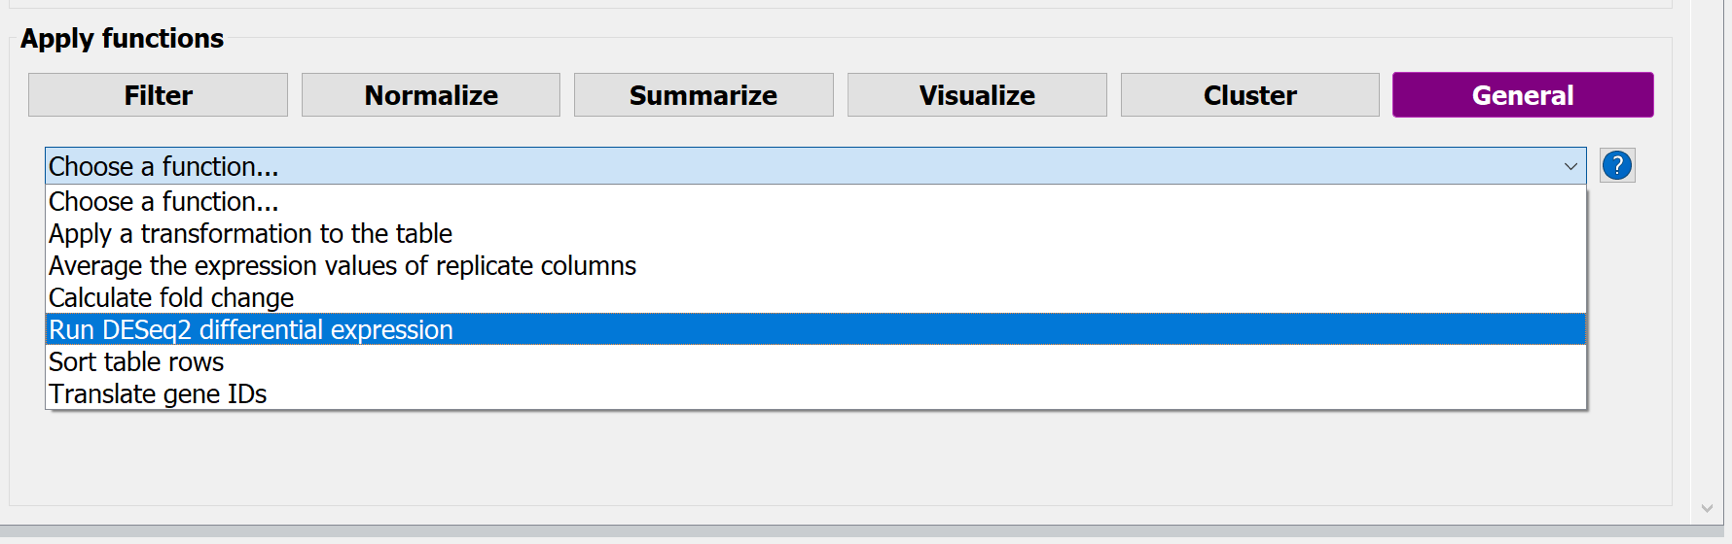
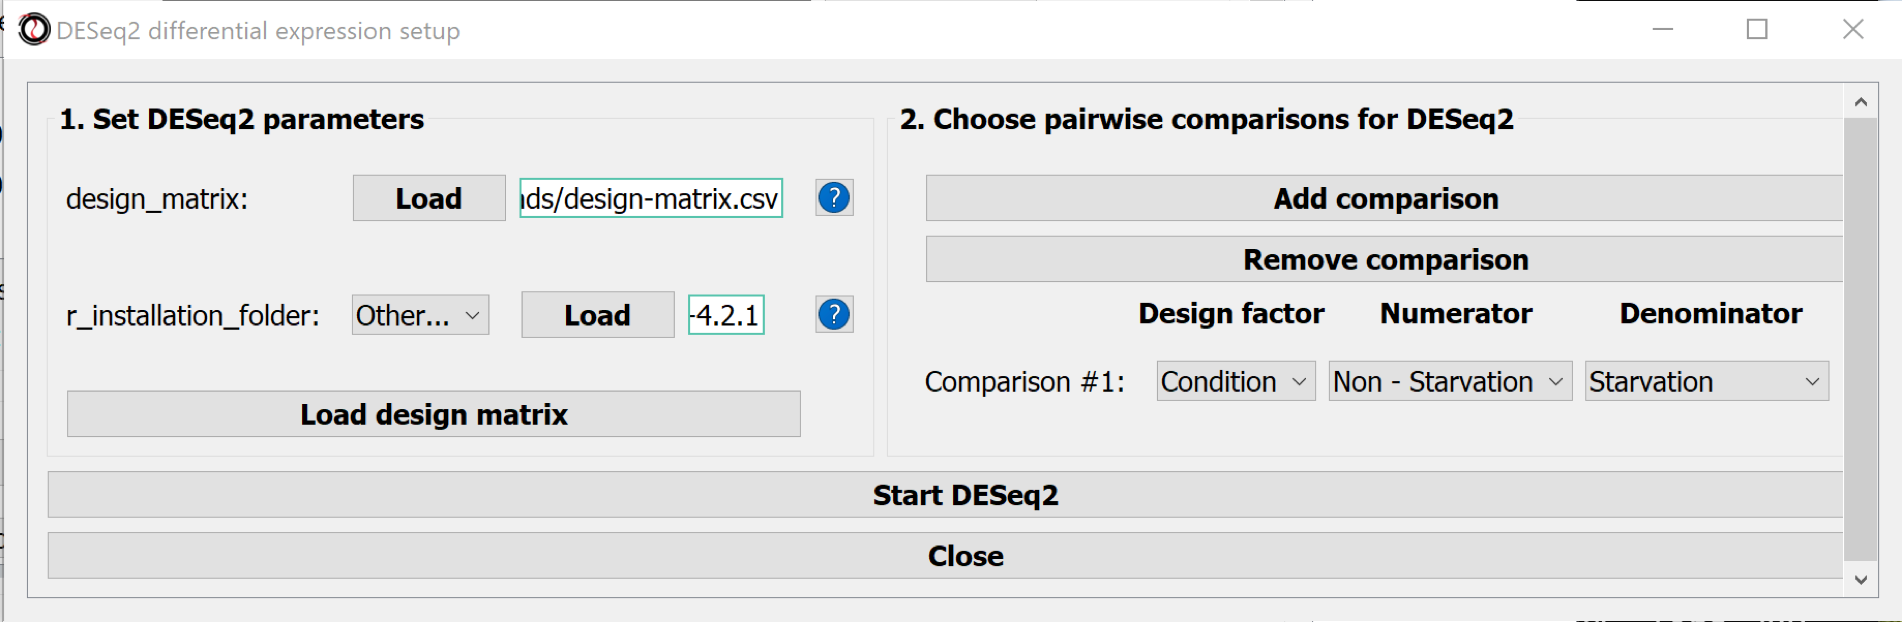
Parameters to set:
- design_matrix : Choosing the design matrix in csv format
- r_installation_folder : Point the programme to the R installation folder (on macOS this is the folder: "/Library/Frameworks/R.framework/Versions/4.2/Resources")
- Use the button Load design matrix to import the design matrix
- Define the comparisons (Numerator - Denominator)
Use the button Start DESeq2 to do the differential analysis
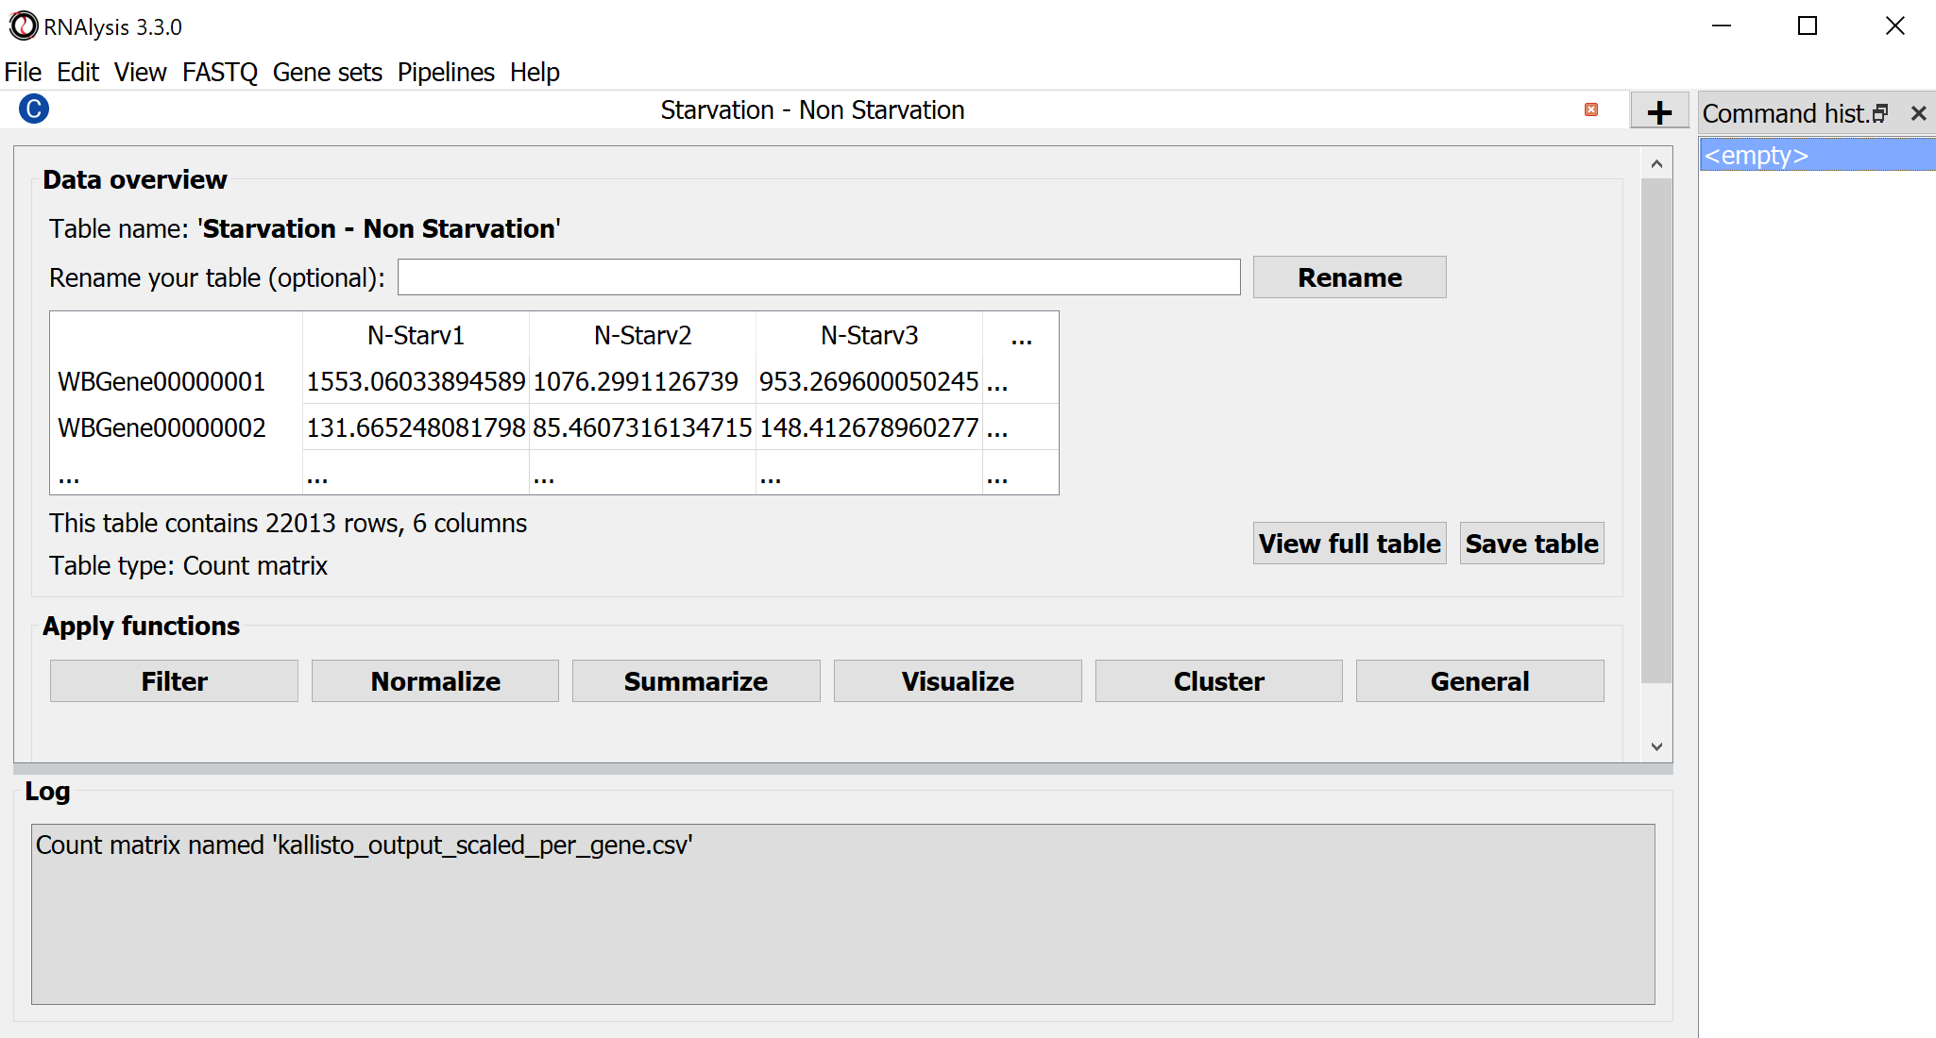
Results:
Comparison table(s)
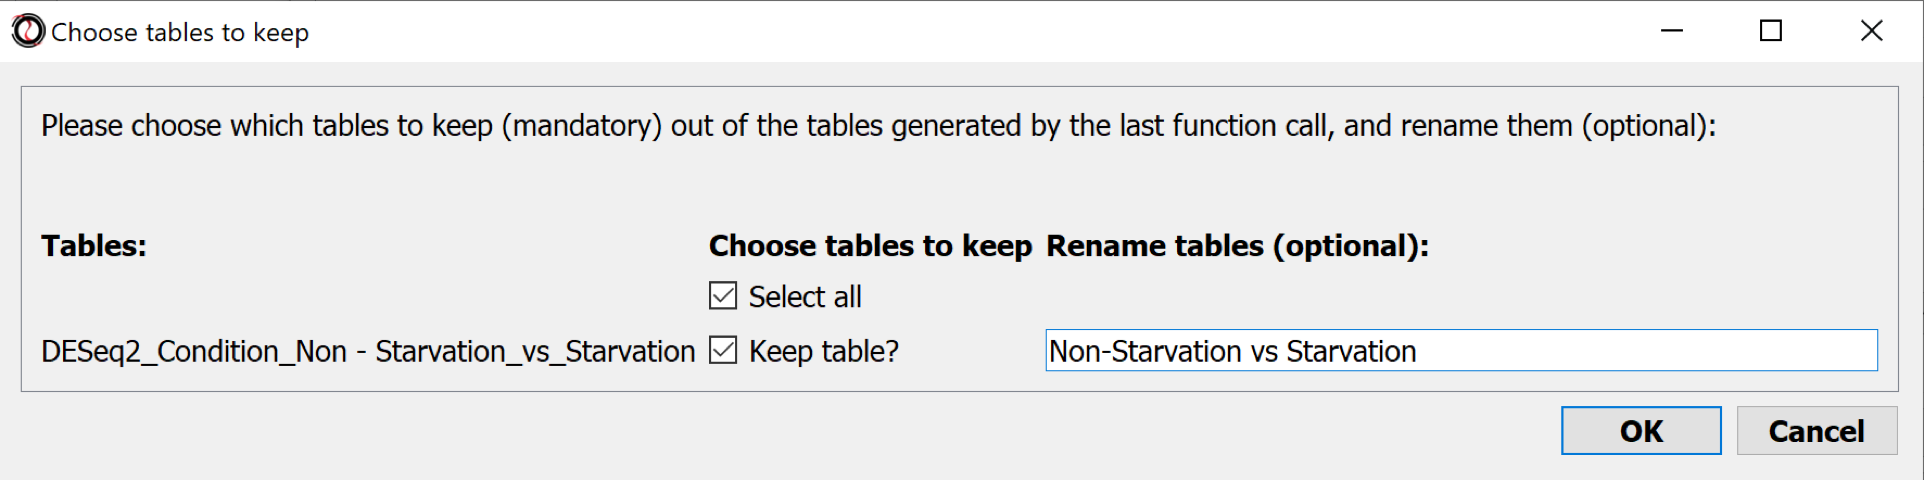
Tables are kept in the main window.
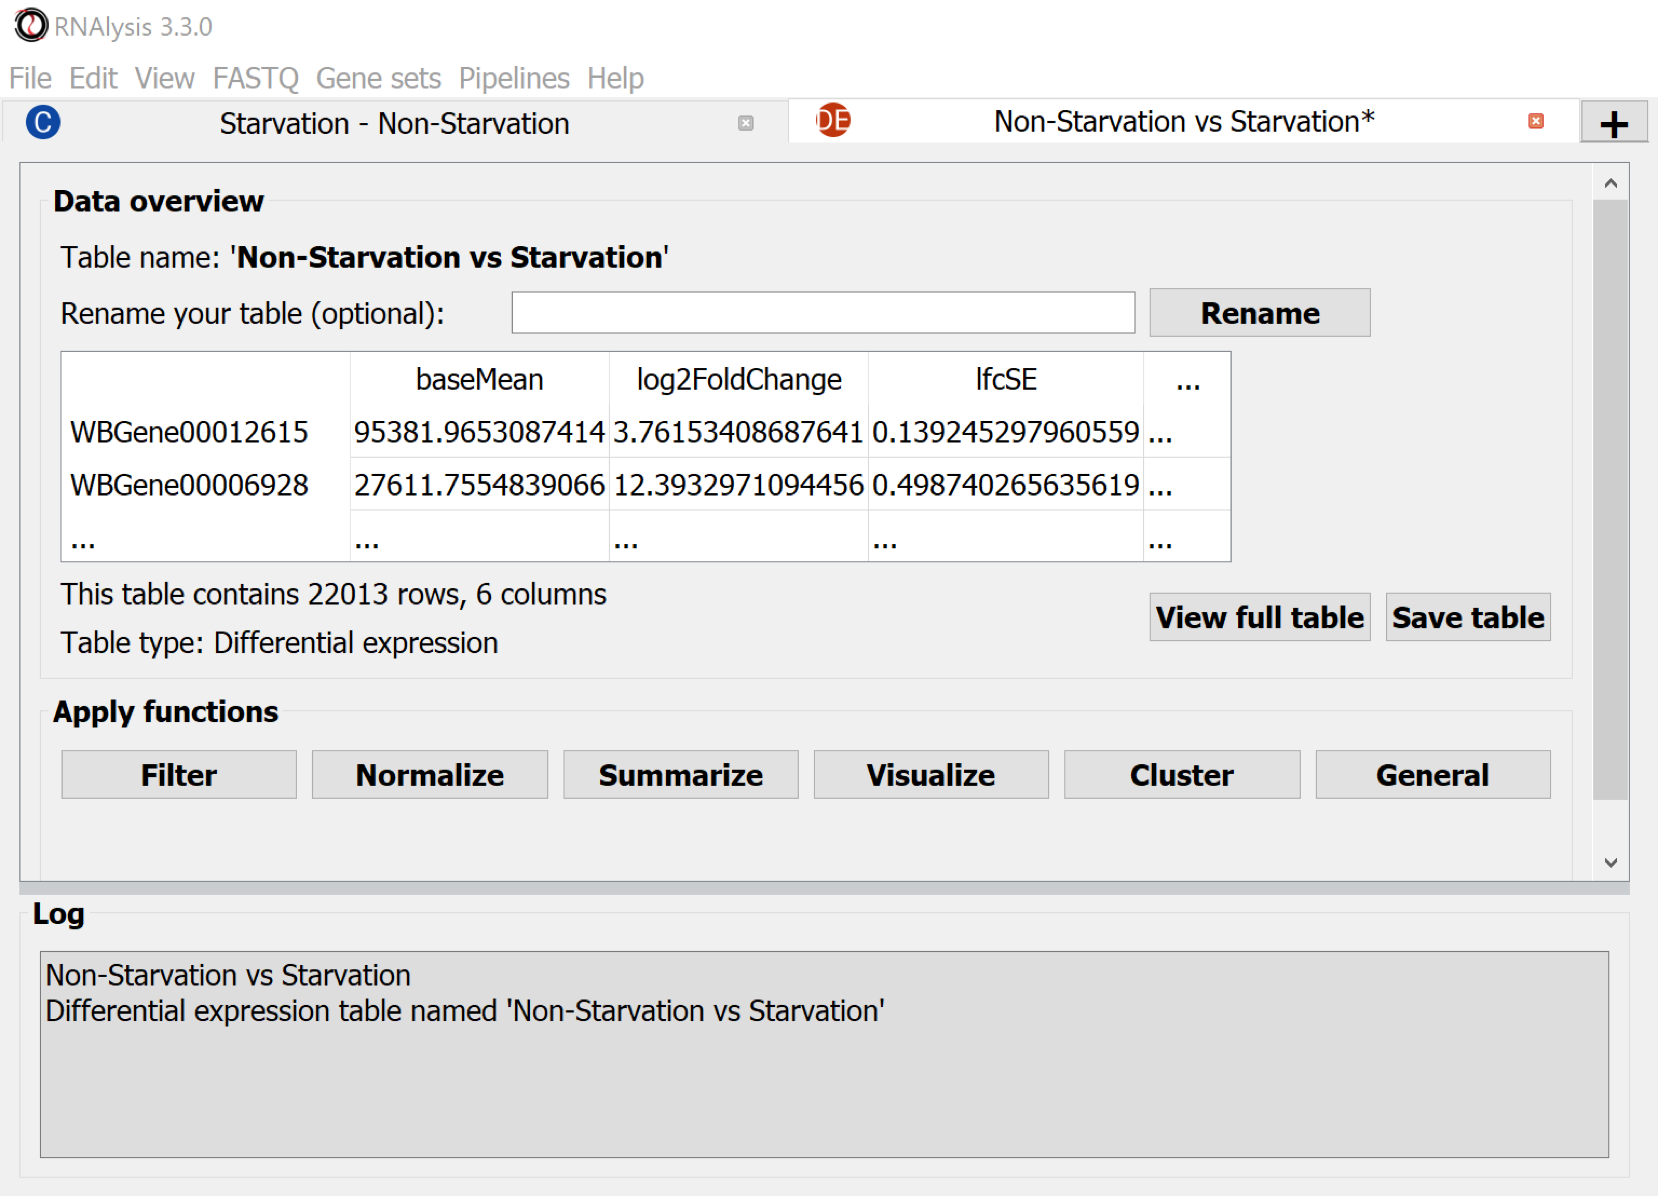
Use the Menu Command: File > Save session... to keep all the tables on disk. Or - use the button Save table to export the differential expression table.
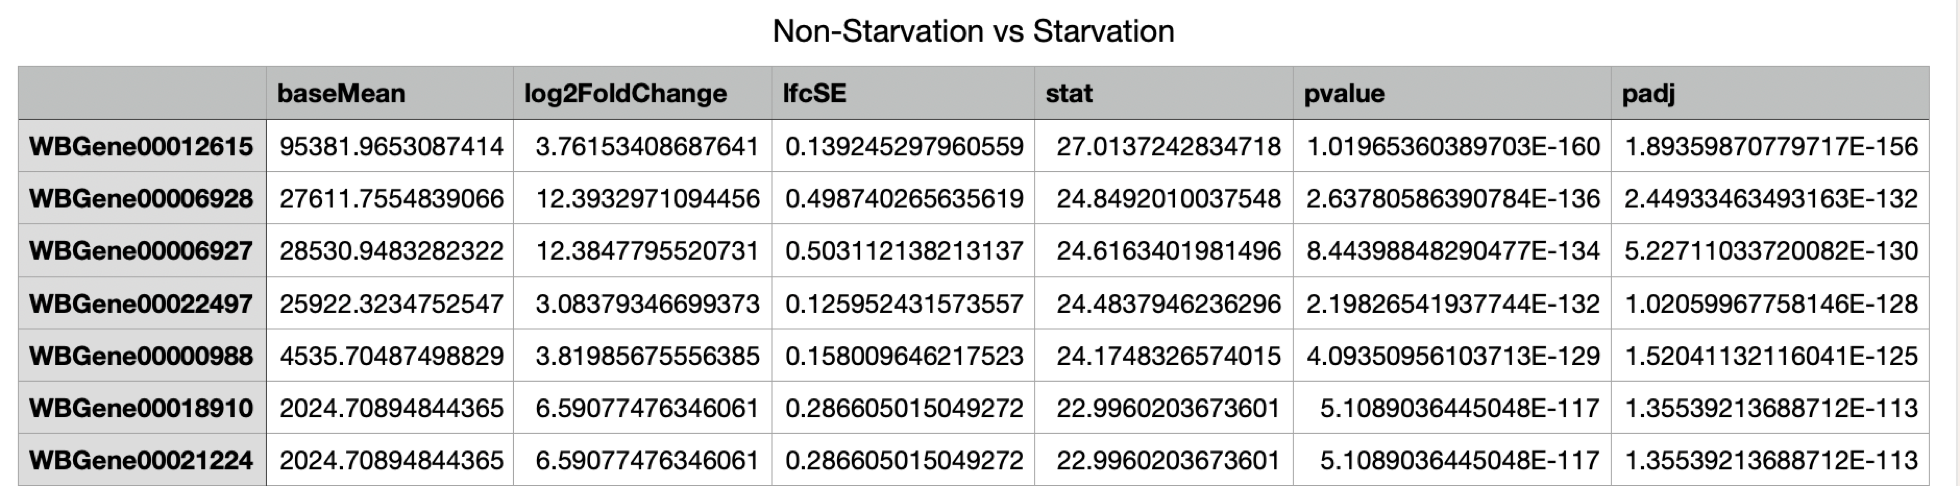
Result table:
The result table contains per gene a mean value, the fold change between the conditions and the p-value which expresses whether this change is statistically significant in relation to the gene's natural variation (as seen in the biological repeats). More profound discussion of DESeq2.
The differential analysis can be visualised.
Comments: matthias.wilm@ucd.ie
.