

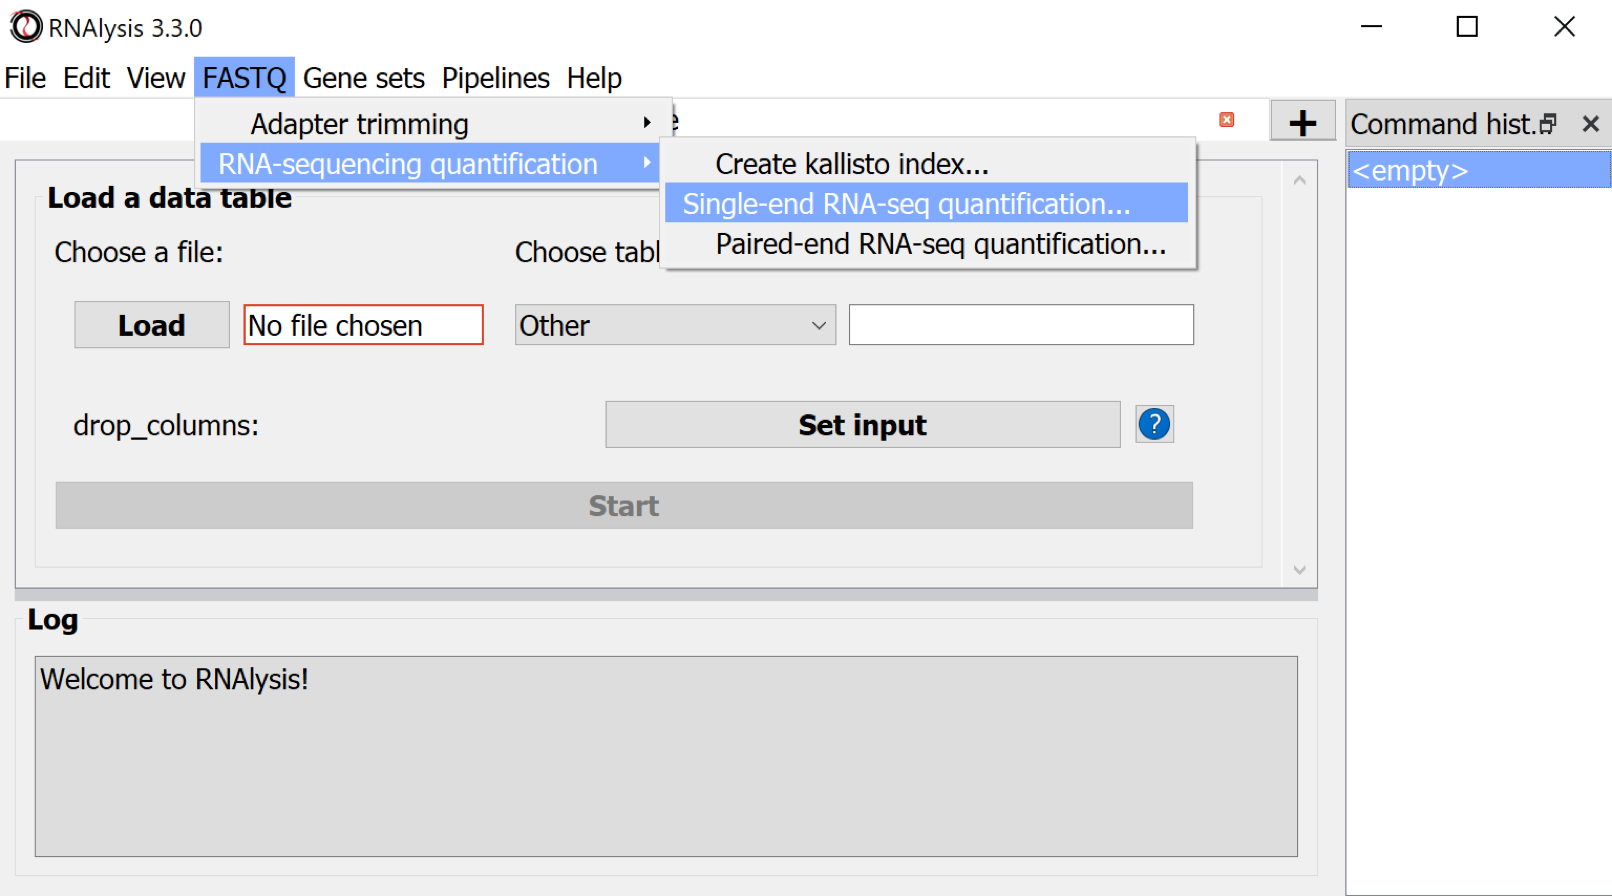
Now, we can proceed with the quantification. We use single ended sequencing data.
Command: FASTQ > RNA-sequencing quantification > Single-end RNA-seq quantification...
Make one folder with all the sequence data: "Sequencing Data" and another, empty folder for the Quantification results: "Quantification Data".
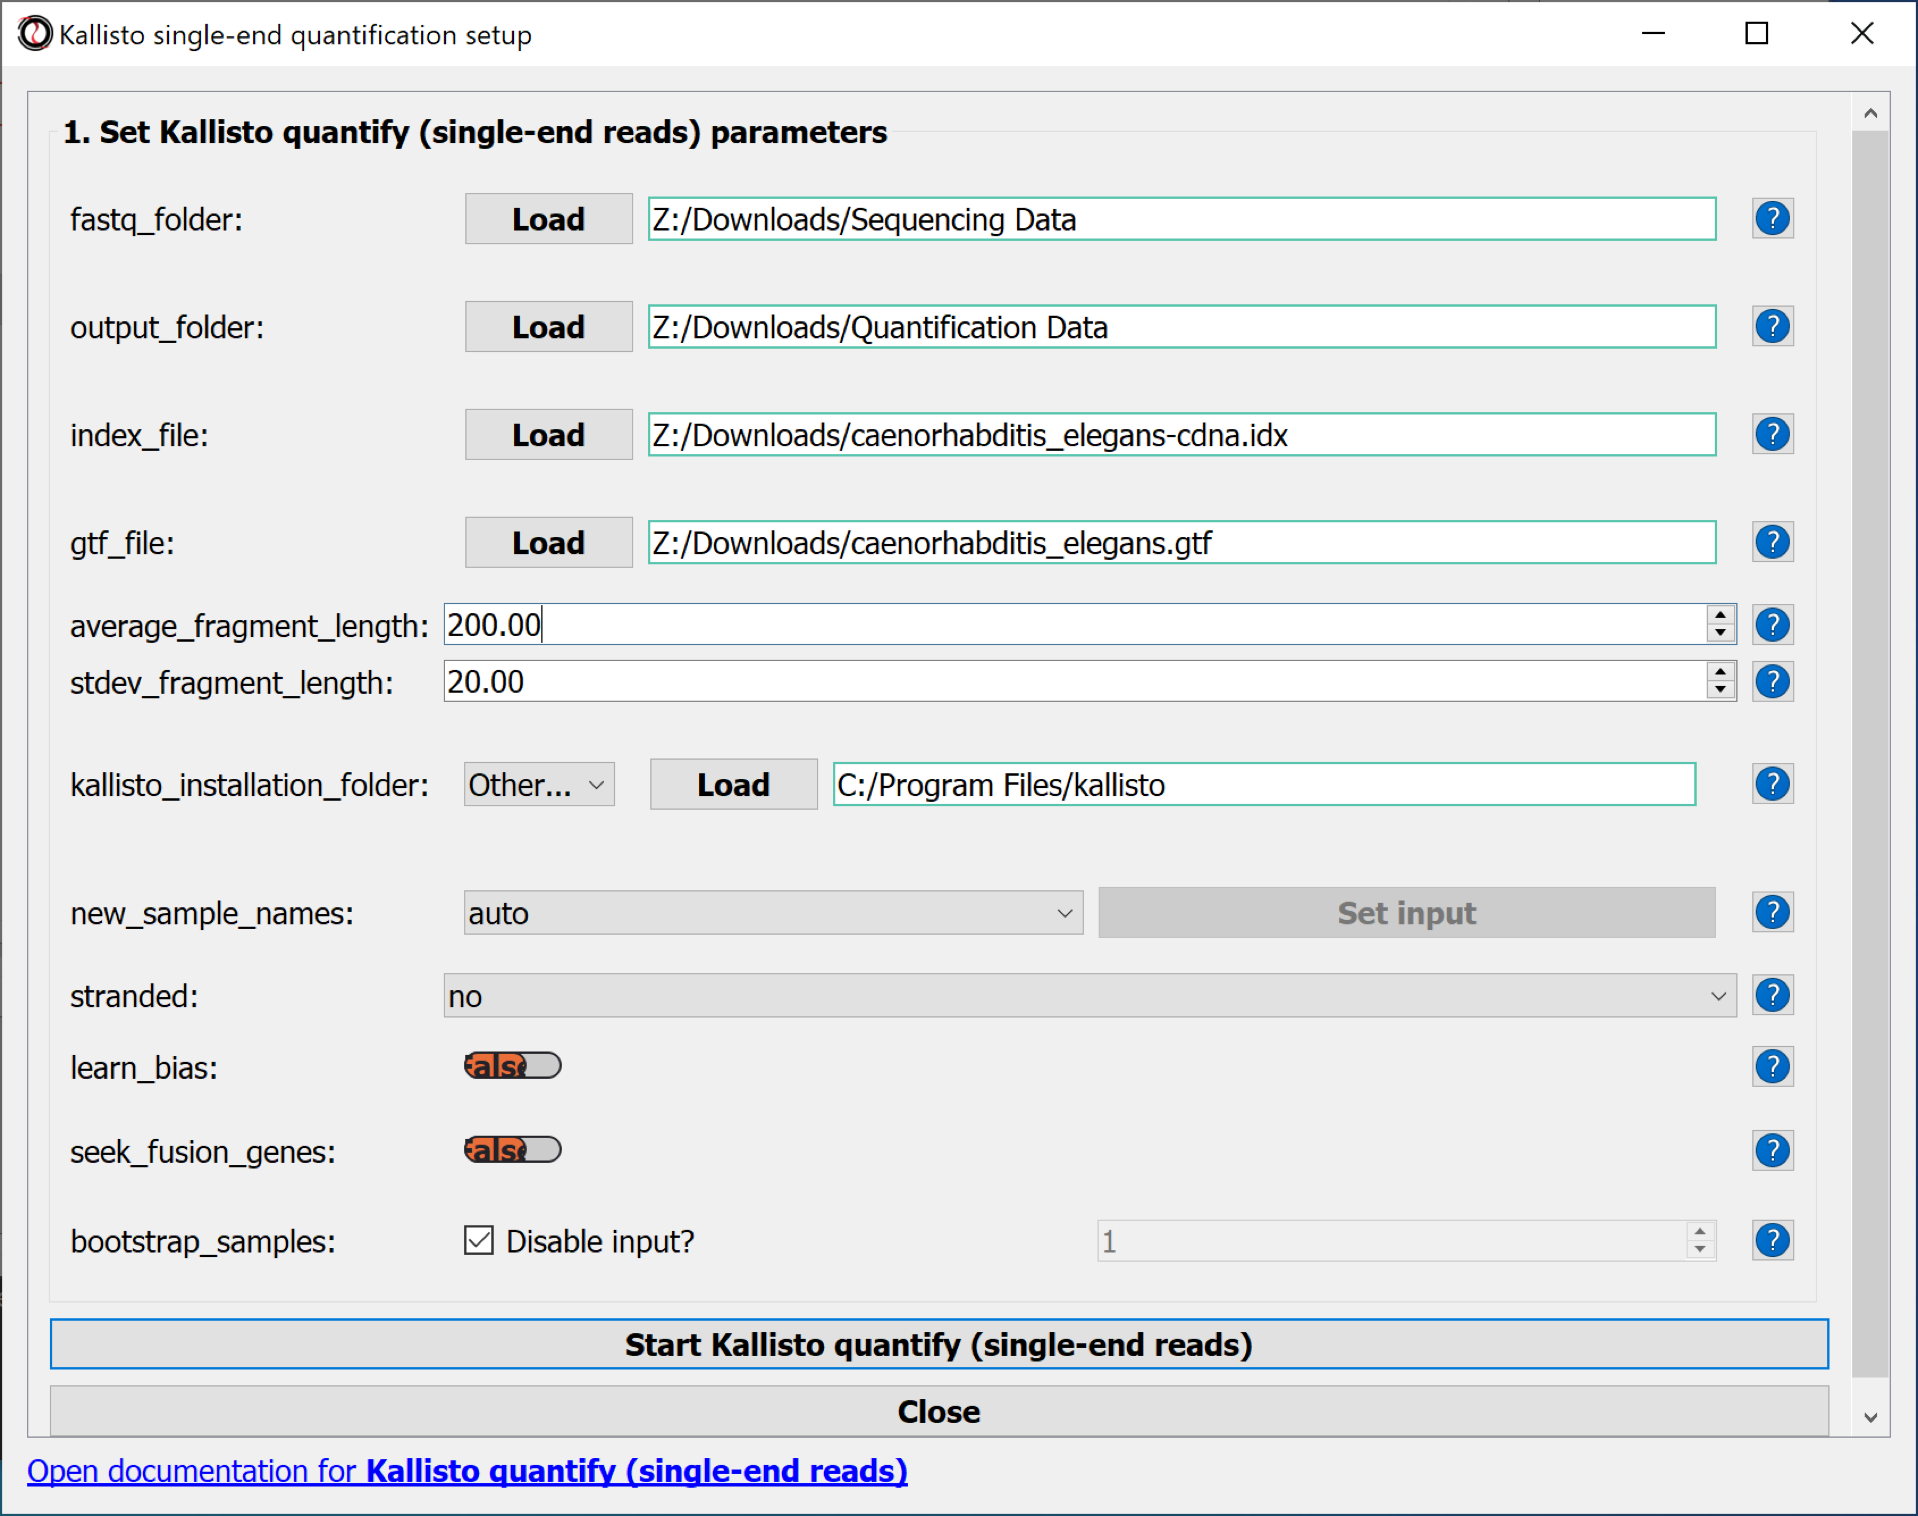
Parameters to set:
- fastq_folder : the folder with the sequencing data
- output_folder : the folder, where the quantification data should be saved
- index_file : the kallisto index file of the cDNA database, transcriptome file
- gtf_file : the gtf file with the gene meta-data information
- average_fragment_length : the average sequence length of the RNA reads - standard parameter chosen
- stdev_fragment_length : the standard deviation of the sequence reading length - standard parameter chosen
- kallisto_installation_folder
- Use the button Start Kallisto quantify (single-end reads) to quantify the RNAs
- Use the "Resource Monitor" application to monitor computer activity
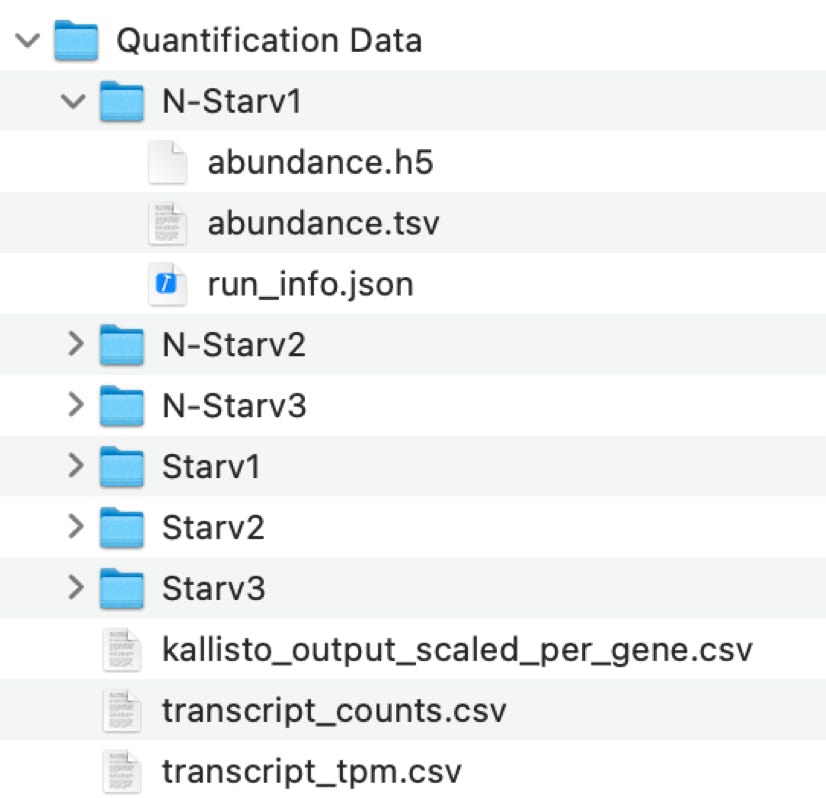
Results:
- Every single data file has been quantified individually:
"abundance.tsv"
- Three summary files were generated in which every sample corresponds to one column:
"kallisto_output_scaled_per_gene.csv"
"transcript_counts.csv"
"transcript_tpm.csv"
Comments: matthias.wilm@ucd.ie
.